- Text size


Home> Statistics/References> Statistics> The Green Transformation Technologies Inventory (GXTI)> Overview of the Results of Patent Information Analysis Based on GXTI
Main content starts here.
Overview of the Results of Patent Information Analysis Based on GXTI
The Japan Patent Office (JPO) conducted the first comprehensive survey taking advantage of the Green Transformation Technologies Inventory (GXTI) prepared by the JPO, aiming to overview trends in patent applications filed with countries and regions in the field of GX technologies.
The survey found that looking at all GX technologies covered by the GXTI, Japan has the largest number of inventions that were filed internationally, and it indicated that Japan has strengths in creating inventions with higher value in such fields as photovoltaic power generation, energy saving in buildings (Net Zero Energy Buildings (ZEB), Net Zero Energy Houses (ZEH), etc.) and secondary (rechargeable) batteries.
For the slide of this page, visit the URL below.
- Slide of the overview of the results of patent information analysis based on GXTI (PDF:1,817KB) [Last updated: 28 December 2023]
For the Abstract of this Analysis Report, visit the URL below.
- Report on the Results of Patent Information Analysis Based on GXTI (Abstract) (PDF: 8,104KB) [Released: 30 May 2023, Revised: 31 October 2023]
Index
- GXTI(Green Transformation Technologies Inventory)
- Survey and Analysis Methodology
- Explanation of Terms
- Overall GX Technology Trends Research
- GXTI Large Category Trends Research
- GXTI Medium Category Trends Research
- Notable Technologies outside GXTI Trends Research
- Summary
GXTI(Green Transformation Technologies Inventory)
In June 2022, the Japan Patent Office (JPO) created and published the Green Transformation Technologies Inventory (GXTI), which provides a bird's-eye view of technologies related to Green Transformation (GX) in five large technology categories and four transversal perspectives.
The JPO also published patent search formulae specific to search patent documents corresponding to each technology category, and to figure out technological trends.
Fig.1 Structure of the GXTI
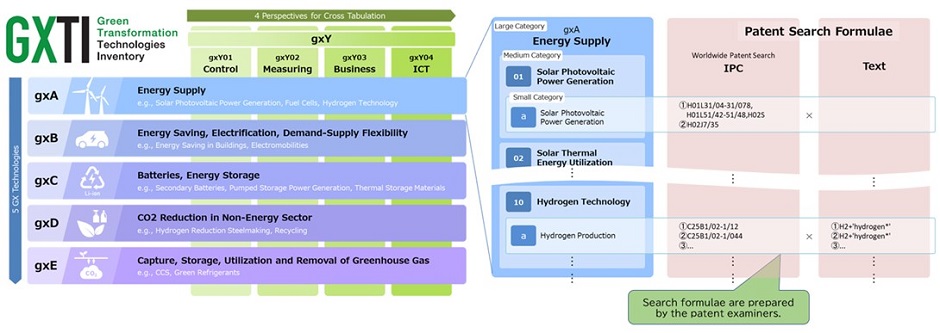
The International Patent Classification (IPC) search formulae make it possible for anyone to conduct a global patent information analysis under the same conditions. In addition, by conducting the analysis under the same conditions, third parties can also compare and evaluate the search results.
The hierarchical structure enables analysis according to the purpose.
Each applicant data can also be obtained by adding the applicant's name to the search formulae.
For example, the results of patent information analysis using GXTI can be utilized as follows:
- The results of patent information analysis help companies figure out their strengths and weaknesses of their GX-related technologies and companies can utilize them in the formulation of their own management strategy and Research and Development strategy on an evidence basis.
- Based on the results of patent information analysis, companies can explain to investors the superiority of their R&D capabilities related to GX-related technologies on an evidence basis.
- Government agencies and NPOs can use the patent information to visualize trends in GX-related technologies in countries and regions around the world, including developing countries, and to support GX initiatives in countries and regions around the world on an evidence basis.
The utilization of GXTI as a common asset in analyzing patent information on GX-related technologies is expected to contribute toward improving the economic and social value of companies, and promoting innovation to solve environmental problems.
Survey and Analysis Methodology
- Technology Categories of Survey: Overall GX Technology, GXTI Large Category, GXTI Medium Category, Notable Technologies outside GXTI. (The search formulae are based on the GXTI version 1.03 published on September 2, 2022.)
- Countries/regions of Survey: Japan, US, Europe, Germany, France, UK, China, Taiwan, South Korea, Canada, India, ASEAN, Australia (including PCT applications)
European applications in this survey include Ireland, Italy, Austria, Netherlands, Switzerland, Sweden, Spain, Slovakia, Czech Republic, Denmark, Germany, Turkey, Norway, Hungary, Finland, France, Belgium, Poland, Portugal, Romania, Luxembourg, UK, and European Patent Convention (EPC). - Period of Survey: 2010-2021 (Filing Year (Priority year))
- Database: Derwent™ Innovation
- Survey implementation date (search date): October 24, 2022 - December 16, 2022
Explanation of Terms
Explanation of Terms
Patent Family:
It refers to a “group consisting of multiple applications” where an application for an invention is filed in a country and then an application is filed in another country/region abroad claiming priority on the basis of the earlier application. By analyzing the number of patent family in a certain technology category by country/region or by applicant, it enables to guess the state of technological development in each country/region or by applicant.
International Patent Family (IPF):
International Patent Family (IPF) means a patent family that includes applications to multiple countries/regions or a patent family that includes applications to the European Patent Office (EPO) or PCT. By analyzing the number of IPFs, it enables to consider the value of the invention and its international influence since IPFs are considered more valuable to the applicant than non-IPFs.
Number of highly cited IPFs:
This is the number of rare IPFs that are cited by the examiner within the top 1% of all IPFs (28 or more citations). Such IPFs are considered highly valuable because of their impact on subsequent patent applications. By conducting the analysis based on the number of IPFs instead of the number of patent families, the effect of the number of language speakers can be reduced.
Overall GX Technology Trends Research
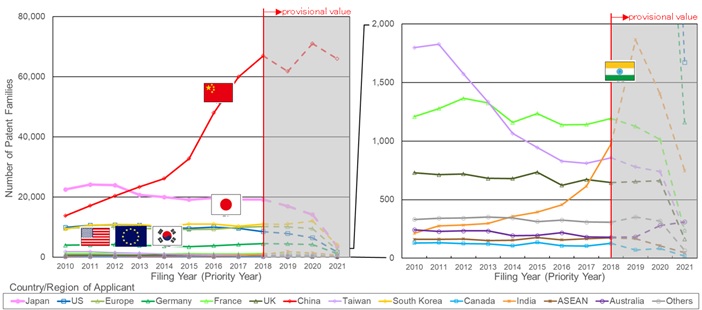
Number of Patent Families by Country/Region of Applicants Yearly Trends
In 2010, the number of patent families by Japanese applicants was the largest, but since 2013, the number has leveled off.
The number of patent families by Chinese applicants increases rapidly, surpassing the number of patent families by Japanese applicants in 2013.
The number of patent families by applicants of most countries/regions remained almost flat. The number of patent families by Indian applicants has been increasing since around 2015.Fig.2 Annual trends in the number of patent families among all GX technologies covered by the GXTI
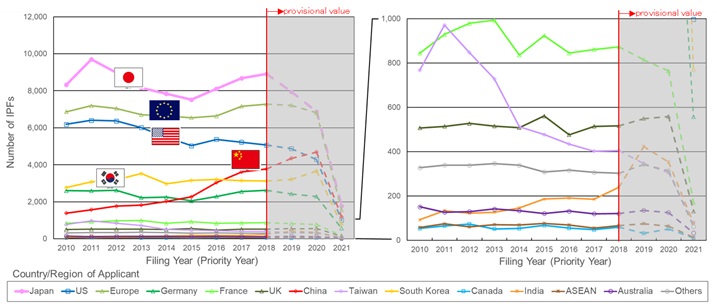
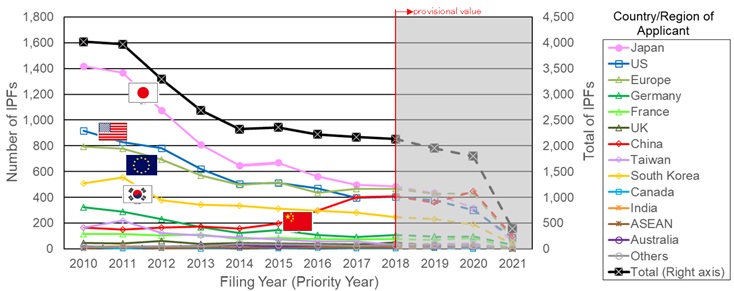
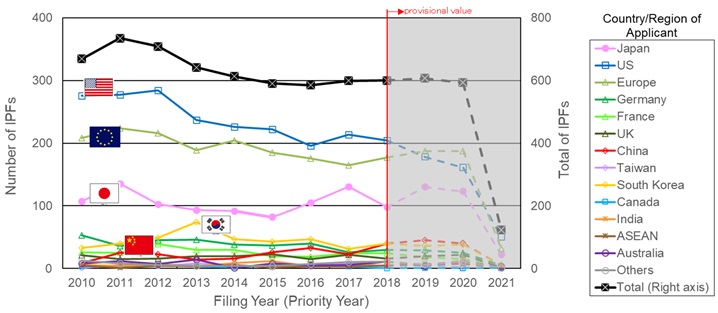
Number of IPFs by Country/Region of Applicants Yearly Trends
The number of IPFs by Japanese applicants remained the highest throughout the entire survey period, indicating the significant presence of Japan in the GX technology field.
The number of IPFs by Chinese applicants is gradually increasing, but the growth is slower than the number of patent families, about half that of Japanese applicants as of 2019.
The majority of applications filed by Chinese applicants are guessed to be filed in only their country.
Fig.3 Annual trends in the number of IPFs among all GX technologies covered by the GXTI
GXTI Large Category Trends Research
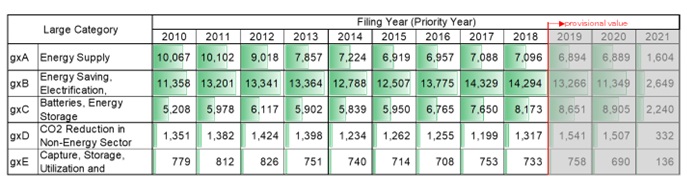
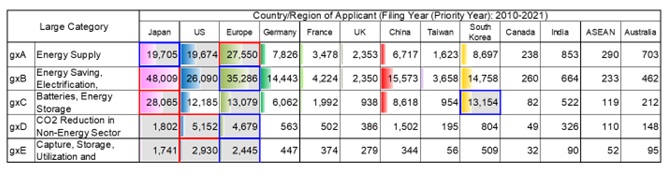
Number of IPFs by Year and by Applicant country/Region
gxB and gxC are increasing, gxD and gxE are flat, and gxA is decreasing.
Table 1 Annual trends in the number of IPFs in large (level 1) categories
The number of IPFs by Japanese applicants is the largest in gxB and gxC.
The number of IPFs by European applicants is the largest in gxA.
The number of IPFs by US applicants is the largest in gxD and gxE.
Table 2 The number of IPFs in large (level 1) categories by country/region of applicants
GXTI Medium Category Trends Research
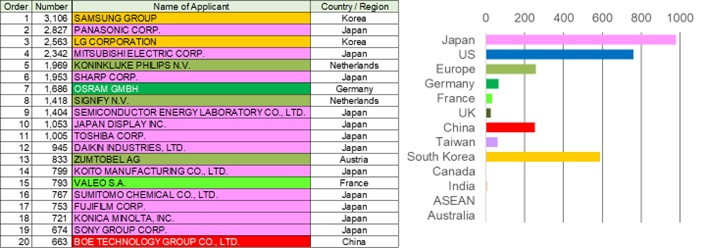
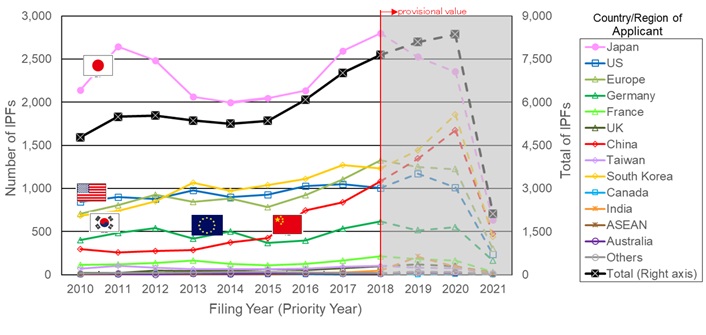
gxA01: Solar Photovoltaic Power Generation
The total number of IPFs is on decreasing, it implies that the industry may be moving from the development phase of new technologies to the dissemination phase of existing technologies.
The number of IPFs by Japanese applicants is the largest in each year from 2010 to 2018 .
While the number of IPFs by Japanese, US, European, and Korean applicants in recent years are decreasing, the number of IPFs by Chinese applicants has increased to the same level as those of Japanese, US, and European applicants.
Fig.4 Annual trends in the number of IPFs in Solar Photovoltaic Power Generation
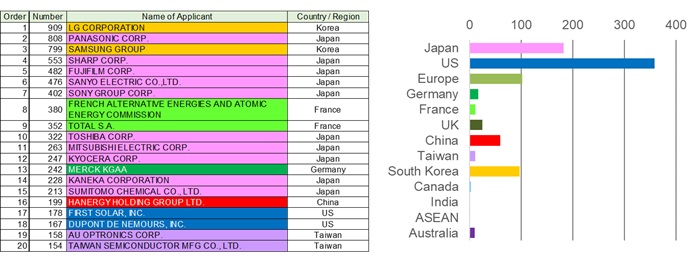
Japanese applicants account for 10 of the top 20 applicants by number of IPFs.
“The number of highly cited IPFs” by US applicants is the largest at 359, that by Japanese applicants is the second largest at 182, that by European applicants is 102, that by Korean applicants is 97, that by Chinese applicants is 59.
These results of the number of IPFs and the number of highly cited IPFs imply that Japanese applicants have strengths and US applicants and Europeans applicants also have presence in the Solar Photovoltaic Power Generation. The rise of the number of IPFs by Chinese applicants in recent years should also be noted.
Table 3 Top 20 applicants in the number of IPFs (left) and the number of highly-cited IPFs (right)
gxB01: Energy Saving in Buildings (ZEB, ZEH, etc.)
Total number of IPFs remained around 7,000.
The number of IPFs by Japanese applicants in each year from 2010 to 2018 is the largest at approximately 2500, highly surpassing that by European applicants that is the second largest.
Fig.5 Annual trends in the number of IPFs in Energy Saving in Buildings (ZEB, ZEH, etc.)
Japanese applicants account for 12 of the top 20 IPF applicants by number of IPFs.
“The number of highly cited IPFs” by Japanese applicants is the largest at approximately 1,000, that by U.S. applicants is the second largest at approximately 800, that by Korean applicants is approximately 600, and that by European applicants and Chinese applicants are approximalty 300 each.
These results of the number of IPFs, highly cited IPFs, and the number of applicants in the top 20 IPFs, implying that Japanese applicants have strength in this technology category.
Table 4 Top 20 applicants in the number of IPFs (left) and the number of highly-cited IPFs (right)
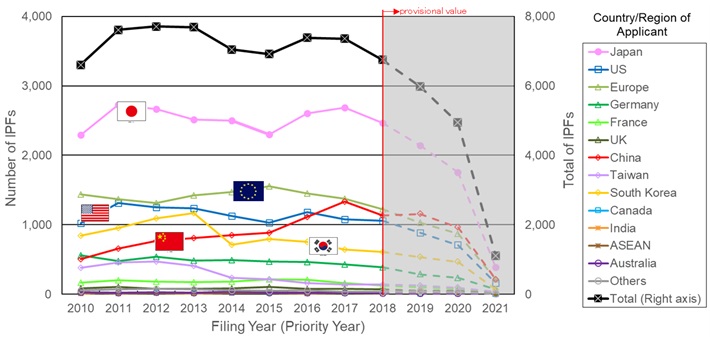
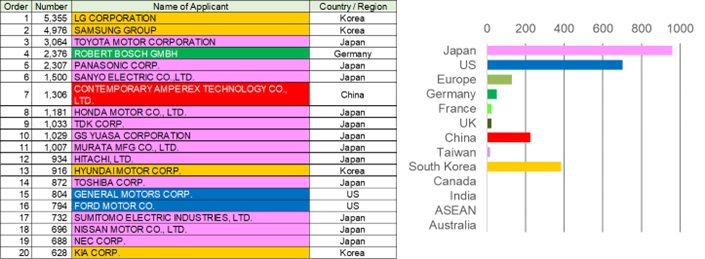
gxC01: Secondary Batteries
The total number of IPFs has increased significantly from less than 5,000 in 2010 to more than 8,000 in 2019 and 2020, implying that R&D has been active.
The number of IPFs by Japanese applicants in each year from 2010 to 2018 is the largest above 2,000, highly surpassing that by second largest country and region at approximately 1,000.
Fig.6 Annual trends in the number of IPFs in Energy Saving in Secondary Batteries
Japanese applicants account for 12 of the top 20 applicants by number of IPFs.
“The number of highly cited IPFs” by Japanese applicants is the largest at 959, and that by US applicants is the second largest at 703, highly surpassing that by Korean applicants in the third largest at 384.
These results imply Japanese applicants have strength in the field of secondary batteries.
Table 5 Top 20 applicants in the number of IPFs (left) and the number of highly-cited IPFs (right)
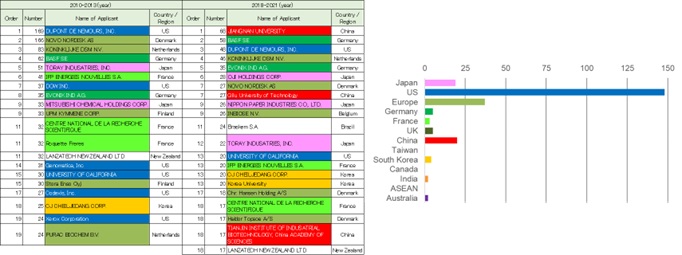
gxD01: Chemical Production from Biomass
This technology category includes biomass plastics, cellulose nanofibers, etc.
The total number of IPFs remains at around 1,000.
The number of IPFs by U.S. applicants was the largest at just under 500 until 2,012, but since 2016 the number of IPFs has been around 300, with a smaller difference from the number of IPFs by European applicants.
The number of IPFs by Japanese applicants is expected to remain at around 100, while that by Chinese applicants is on the rise and is expected to equal that by European and US applicants by around 2020.
Fig.7 Annual trends in the number of IPFs in Chemical Production from Biomass
The number of U.S. applicants in the Top 20 applicants by number of IPFs decreased from 6 in 2010-2013 to two in 2018-2021.
No Chinese applicants were included Top 20 Applicants in 2010-2013, but 3 Chinese applicants were included in 2018- 2021. It is also notable that all 3 applicants are universities and research institutes.
Non-Chinese universities and research institutions are also included in the Top 20 applicants, such as IFP New Energy (France) and the University of California (U.S.). In particular, universities and research institutions accounted for 7 out of 21 applicants in 2018-2021.
Table 6 Top 20 applicants in the number of IPFs (left) and the number of highly-cited IPFs (right)
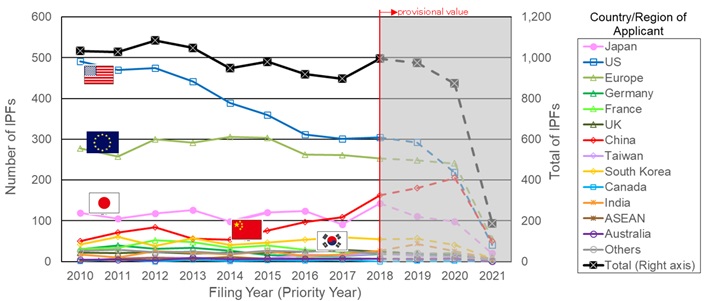
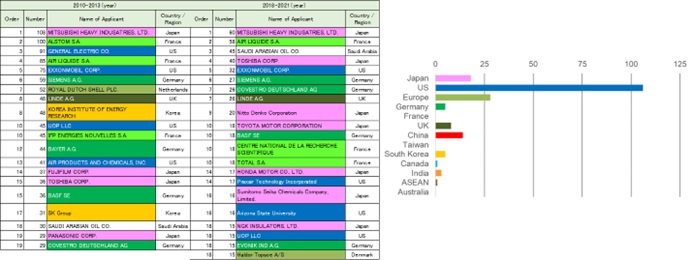
gxE01: CCS, CCUS, Negative Emission
The total number of IPFs remained generally flat at around 600.
The number of IPFs by US applicants has decreased from less than 300 to around 200, and that by European applicants has also decreased from over 200 to less than 200.
On the other hand, the number of IPFs by Japanese applicants has remained generally flat between 100 and 150. The gap among the number of IPFs by U.S. applicant, that by European applicant, and that by Japanese applicants has narrowed.
Fig.8 Annual trends in the number of IPFs in CCS, CCUS, Negative Emission
Looking at the top 20 Applicants of IPFs, the number of Japanese applicants increased from 4 in 2010-2013 to 7 in 2018 to 2021.
Some universities and research institutes are included in the Top 20 applicants, such as the Korea Institute of Energy Research (Korea), IFP New Energy (France), and Arizona State University (US).
Table 7 Top 20 applicants in the number of IPFs (left) and the number of highly-cited IPFs (right)
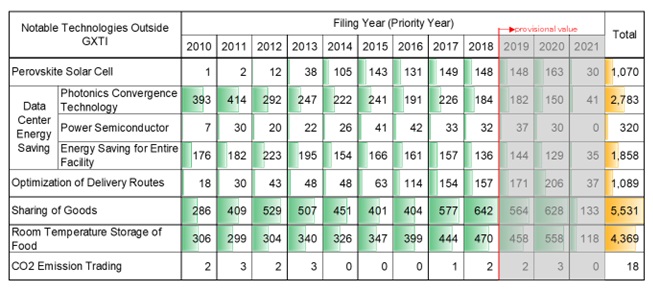
Notable Technologies outside GXTI Trends Research
Number of IPFs by Year
The number of IPFs for “Perovskite Solar Cell” increased rapidly from 2010 to 2015 and remained constant since then.
"Optimization of Delivery Routes" increased rapidly from 2010 to 2020.
The "sharing of goods" (car sharing, etc.) and "preservation of food at room temperature" (canned food, dried food, etc.) increasing.
"Photonics Convergence Technology” has decreased.
Table 8 Annual trends in the number of IPFs in notable technologies outside GXTI
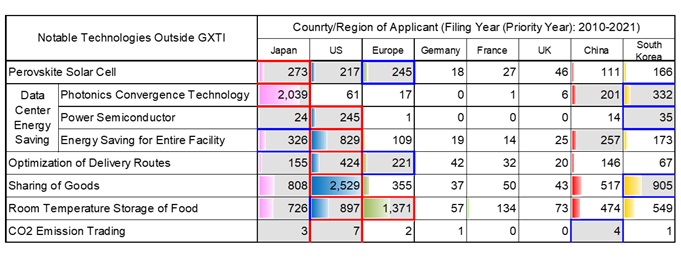
Number of IPFs by Applicant Country/Region
The number of IPFs by Japanese applicants is the largest for “Perovskite Solar Cell” and “Photonics Convergence Technology” and is the second or third largest for others.
The number of IPFs by US applicants is the largest for the five surveyed technologies and the third largest for the other two technologies.
The number of IPFs by European applicants is the largest for “Room Temperature Storage of Food” and is the second largest for the other two technologies.
The number of IPFs by Chinese and Korean applicants is the second or third largest for three surveyed technologies.
Table 9 The number of IPFs in notable technologies outside GXTI by country/region of applicants
Summary
Overall GX Technology
The number of IPFs by Japanese applicants is the largest in each year throughout the survey period for which definite data are available implies that inventions created in Japan are expected utilized in numerous countries/regions.
Large Categories of GXTI
- In terms of the total number of IPFs during the entire survey period, the category of Energy Saving, Electrification and Demand-Supply Flexibility (gxB) accounted for the largest number, followed by the categories of Energy Supply (gxA), Batteries/Energy Storage (gxC), CO2 Reduction in Non-Energy Sector (gxD), and Capture, Storage, Utilization and Removal of Greenhouse Gas (gxE).
- The annual trends in the number of IPFs during the survey period for which definite data are available show increasing trends in the category of Energy Saving, Electrification and Demand-Supply Flexibility (gxB), and the category of Batteries/Energy Storage (gxC).
- In terms of the total number of IPFs by applicant country and region during the entire survey period :
- That by European applicants is the largest in the category of Energy Supply (gxA);
- That by Japanese applicants is the largest in the category of Energy Saving, Electrification and Demand-Supply Flexibility (gxB), and also in the category of Batteries/Energy Storage (gxC)
- That by U.S. applicants is the largest in the category of CO2 Reduction in the Non-Energy Sector (gxD), and also in the category of Capture, Storage, Utilization and Removal of Greenhouse Gas (gxE).
※ gxA is "Energy Supply;" gxB is "Energy Saving, Electrification, and Demand-Supply Flexibility"; gxC is "Batteries, Energy Storage;gxD is "CO2 Reduction in Non-Energy Sectors; and gxE is "Capture, Storage, Utilization and Removal of Greenhouse Gas."
Medium Categories of GXTI
The annual trends in the number of IPFs during the survey period for which definite data are available shows the following:
- In the category of [gxA01] "Solar Photovoltaic Power Generation“, the number of IPFs by Japanese applicants is the largest in each year, but there are an overall downward trend, except for that by Chinese applicants.
- In the category of [gxB01]"Energy Saving in Buildings (ZEB, ZEH, etc.) “, the number of IPFs by Japanese applicants (about 2,500 in each year) is the largest, and much larger than that by European applicants (about 1,500 in each year).
- In the category of [gxC01] "Secondary Batteries", the number of IPFs by Japanese applicants is the largest in each year at more than 2,000 throughout the period, highly surpassing that by US, European, and Korean applicants (around 1,000).
- In the category of [gxD01]"Chemical Production from Biomass", the number of IPFs by U.S. applicants was the largest at less than 500 until 2,012, but since 2016 the number of IPFs has been around 300, with a smaller difference from the number of IPFs by European applicants. The number of IPFs by Japanese applicants is guessed to remain at around 100, while that by Chinese applicants is increasing and is expected to equal that by European and US applicants by around 2020.
- In the category of [gxE01]"CCS, CCUS, Negative Emission", the number of IPFs by US applicants is the largest and that by European applicants is the second largest decreased to about 200 between 2010 and 2018. On the other hand, the number of IPFs by Japanese applicants has remained generally unchanged between 100 and 150. The gap among the number of IPFs by U.S. applicants, that by European applicants, and that by Japanese applicants has narrowed.
Focusing on universities and research institutes, such as universities in the United States, Europe, China, and South Korea are ranked in the top 20 in the number of IPFs in the category of [gxE01]"CCS, CCUS, Negative Emission" and in the category of [gxD01]"Chemical Production from Biomass".
Notable Technologies outside GXTI
In terms of the number of IPFs for the entire survey period for notable technologies outside GXTI:
- The number of IPFs by Japanese applicants is the largest for “Perovskite Solar Cell” and “Photonics Convergence Technology” and is the second or third largest for others.
- The number of IPFs by U.S. applicants is the largest for power semiconductors, facility-wide energy saving, delivery route optimization, goods sharing, and CO2 emissions trading and the third largest for the other two technologies.
- The number of IPFs by European applicants is the largest for “Room Temperature Storage of Food” and is the second largest for the other two technologies.
[Last updated 28 December 2023]
|
Contact |
|
Policy Planning and Research Division E-mail:PA0930@jpo.go.jp |
Copyright © Japan Patent office. All Rights Reserved.