Home> Announcements> International topics> Trilateral Cooperation (JPO-EPO-USPTO)> PROJECT24.2 report (english version)> Appendix1.2 Hypothetical application 2
Main content starts here.
Appendix1.2 Hypothetical application 2
HYPOTHETICAL APPLICATION
CASE 2
An AUTOMATIC ORDERING SYSTEM
[1] This invention relates to a system of predicting future demand and ordering goods at a retail shop and more particularly to an automatic predicting and ordering system suitable for ordering work and inventory control of goods distributed daily, sold in mass at a supermarket or the like, for which demand changes greatly.
[2] As described in NIKKEI Communication, Jan. 4, 1988, pp 68-72, in a conventional automatic ordering system, the inventory control caretaker such as shop manager precedently sets up a proper shop stock standard by considering the past results and an actual change of shop stock is collated with the shop stock standard so that when out-of-stock tends to occur, a supplemental order may be effected automatically. Otherwise, ordering work is done under the command of experience and intuition of the person in charge of ordering.
[3] In the conventional system, factors of change of demand are not considered in respect of individual items of goods and when the difference between shop stock standard and stock volume reaches a predetermined level, ordering is carried out automatically, raising problems that in respect of goods for which demand changed greatly, goods items being in great demand become out of stock frequently while items of goods being in how demand are stocked in surplus.
[4] An object of this invention is to provide an automatic predictor system based on past time series data and factors of change.
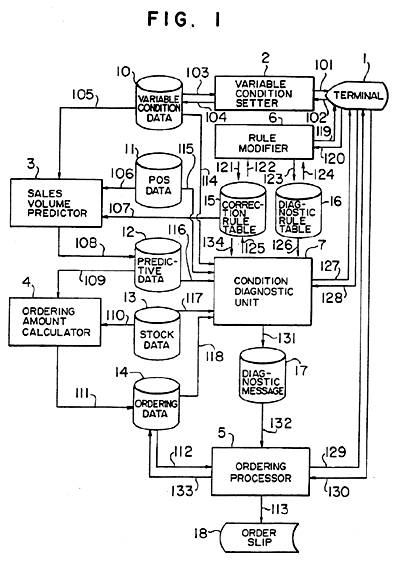
[5] Another object of this invention is to provide an automatic sales volume predictor system based on POS data and factors of change of the sales volume of goods.
[6] Further object of this invention is to provide an automatic ordering system which can enable the stock caretaker such as shop manager to grasp factors of change of demand for individual goods in ordering work of goods for which demand changes, so as to perform determination of the order amount and diagnosis of the stock volume of individual goods in accordance with the condition or status of own shop.
[7] These objects and advantages of the invention will be apparent from the description herein or can be learned from practicing the invention to those skilled in the art.
[8] Figure 1 is a schematic block diagram illustrating an embodiment of an automatic ordering system according to the invention.
Figure 2 is a flow chart showing the operation of the Fig.1 system.
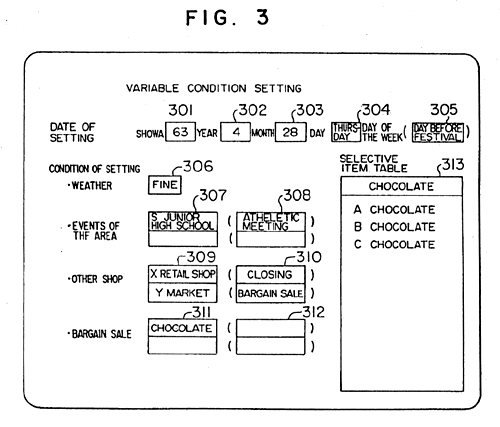
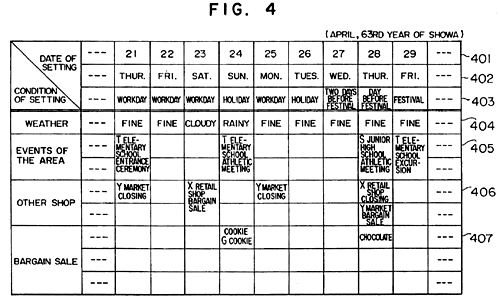
Figure 3 shows a variable condition setting screen.
Figure 4 shows an example of variable condition data.
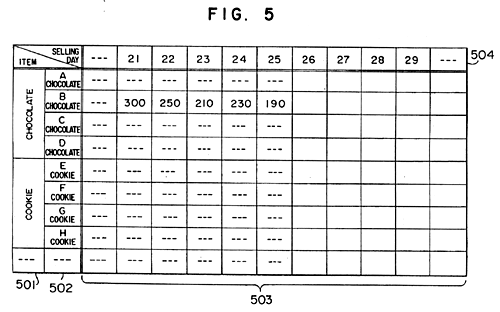
Figure 5 shows an example of POS data.
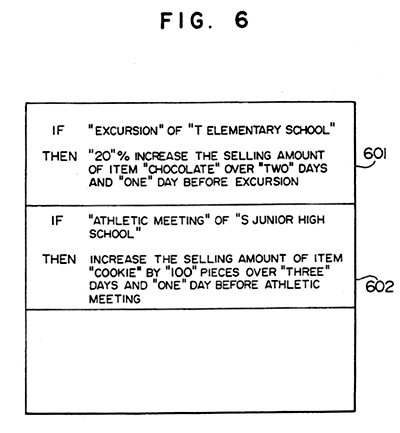
Figure 6 shows an example of a correction rule table.
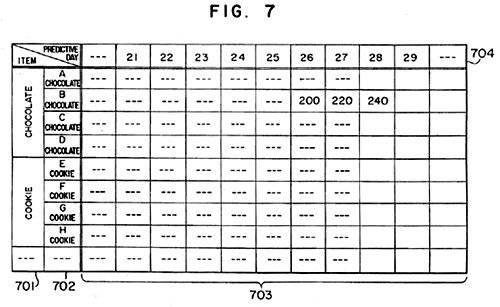
Figure 7 shows an example of predictive data.
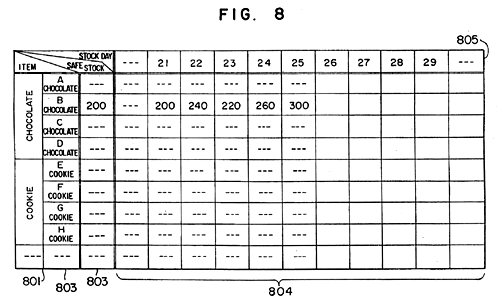
Figure 8 shows an example of stock data.
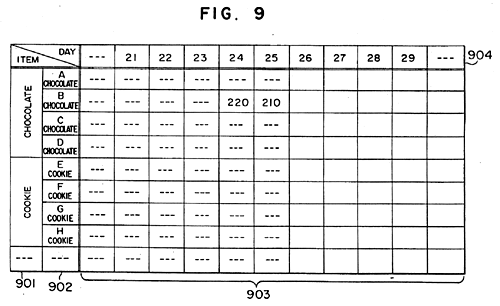
Figure 9 shows an example of ordering data.
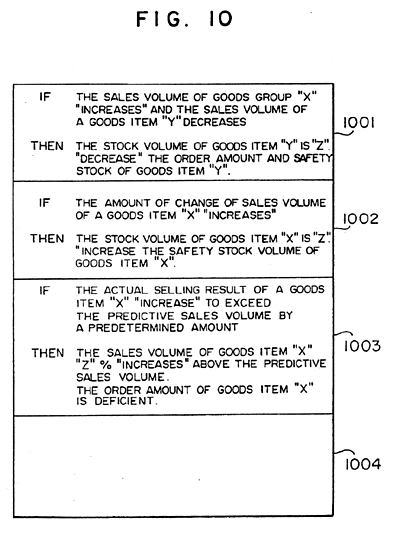
Figure 10 shows an example of a diagnostic rule table.
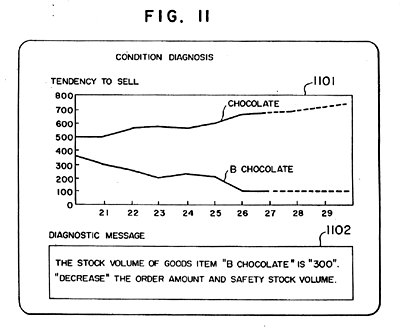
Figure 11 shows a condition diagnostic screen.
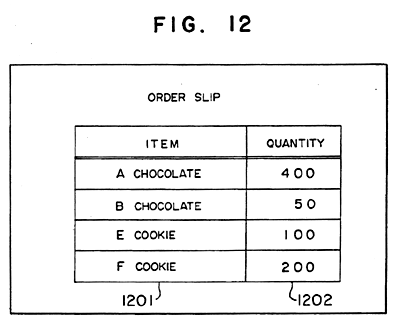
Figure 12 shows an example of an order slip.
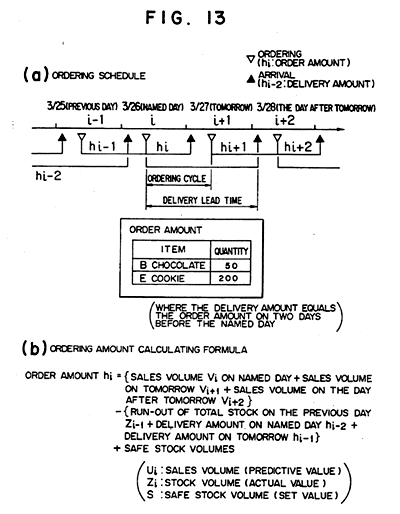
Figure 13 explains ordering work to which the invention is applied.
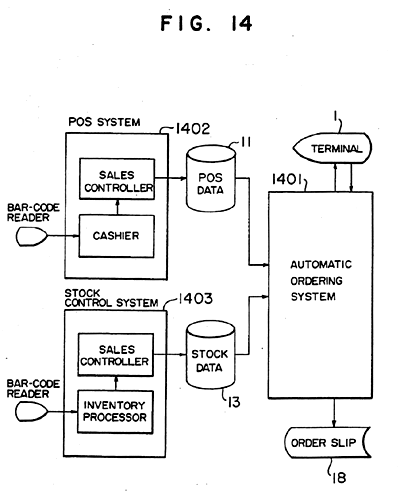
Figure 14 is a block diagram illustrating an example of a retail shop system to which the invention is applied.
[9] The invention will now be described by way of example and reference to Figs. 1 to 14.
[The first embodiment]
[10] The automatic predictor system is constructed as shown, in block form, in Fig.1. Thus, this system comprises a terminal 1 through which input/output of information is effected by the worker, a variable condition setter 2 for setting variable condition data 10 indicative of factors of change, a predictor (embodied as SALES VOLUME PREDICTOR in Fig.1) 3, responsive to variable condition data 10, past time series data (embodied as POS DATA in the Fig.1) 11 and a correction rule table 15 for storing correction rules used to correct the initial predictive data, for predicting the predictive data.
[11] The first embodiment is explained , in the case of predicting sales volume.
[12] Firstly, the variable condition setter 2 provides a variable condition setting screen which is sent via a signal line 101 and displayed on the terminal 1.
[13] The worker inputs information indicative of events to be given in the market area and items of goods on bargain sale at own shop.
[14] The information is applied via a signal line 104 to the variable condition data 10 to either input new data representative of the variable condition valid for a few days which is necessary for predicting the volume of sales or change the contents of the variable condition data.
[15] Fig.3 shows an example of the variable condition setting screen and Fig.4 shows an example of the variable condition data 10.
[16] Information about calendar (day of the week and festival) has previously been stored in the variable condition data 10.
[17] In order to newly input or change the variable condition necessary to predict the volume of sales, the worker first input a data of setting the variable condition at variable condition setting blanks 301,302 and 303. As described previously, data indicative of a day of the week 402 and festival 403 and the variable condition inputted during a previous ordering work have precedently been stored in the variable condition data 10.
[18] The variable condition setter 2 fetches one of the data and variable condition corresponding to the inputted setting date 401 from the variable condition data 10 via a signal line 103 so as to display it on the variable condition setting screen. Items of information about weather 306, place 307 and name 308 of an event, name 309 and selling states (for example, shop closing and bargain sale ) 310 of others shops, group 311 of items of goods on bargain sale at own shop (for example, chocolate, cookie and curry) and trade name 312 are displayed at a selective item table 313 on the variable condition setting screen. The worker selects information items from the selective item table 313 and input them. The inputted information is then supplied via a signal line 102 to the variable condition setter 2 which in turn updates the contents of the variable condition data 10 or input new data thereto via the signal line 104.
[19] The sales volume predictor 3 is then supplied with the update or newly inputted contents of variable condition data 10 via a signal line 105, POS data 11 collected at a POS terminal via a signal line 106 and correction rule table 15 via a signal line 107 and it performs calculation to predict the sales volume. The variable condition data 10, POS data 11 and correction rule table 15 supplied to the sales volume predictor 3 are exemplified in Figs.4, 5 and 6, respectively.
[20] The calculation of sales volume prediction is performed as will be described below. For example, prediction is effected on the assumption that the date named is the 26th day and goods ordered on the 26th day are scheduled to be delivered two days later i.e., on the 28th day, thereby predicting on the named 26th day the volume of sales expected to occur on the 28th day.
[21] Firstly, sales volumes which occurred on a few old days, each being the same day of the week (Thursday) as that of the day for which the sales volume is predicted i.e., the 28th day, are employed as the past time series data and averaged in respect of each item of goods. This averaged data is used as initial predictive data. To explain with reference to Fig.5, sales volumes, generally indicated by 503, which occurred on a few old days, each being the same day of the week, are averaged in respect of an item of B chocolate. For example, the thus averaged predictive data is assumed to be "200". This data "200" is used as initial predictive data.
[22] Subsequently, the correction rules are activated by information from the variable condition data 10 to correct the initial predictive data. More specifically, due to the fact that the event 405 to be given on the "29-th" setting day is a "T elementary school excursion" as indicated in the variable condition data 10 of Fig.4 and a correction rule 601 of Fig.6 shows a "20% increase" in the volume of sales of "chocolate" under the above condition, the initial predictive data "200" is corrected so as to be 20% increased to "240" and the corrected data is stored into the predictive data 12 via a signal line 108 (step 202). An example of the predictive data 12 is shown in Fig.7.
[23] It is apparent to the person skilled in the art that this predictor system can apply not only sales volume prediction but also various kinds of prediction ; e.g. electric power supply prediction , traffic volume prediction , etc..
[The second embodiment]
In ordering work, lead time for procurement of delivered goods (hereafter referred to as delivery lead time) is set and the delivery lead time is a few days after the date of ordering goods. Accordingly, it is necessary to forecast or predict the volume of sales occurring before the delivery lead time and determine the amount of orders (ordered goods) by taking into account the volume of inventories at an ordering time point and the safe total stock which is set to prevent out-of-stock. In case where the ordering cycle (equivalent to an interval of time between adjacent orders) is shorter than the delivery lead time, the amount of orders must be determined by additionally taking into account the amount of previously ordered goods which are scheduled to be delivered before the current delivery lead time.
In the second embodiment, it is assumed that the ordering work is performed one every day in accordance with a daily ordering schedule as shown at (a) in Fig.13 and ordered goods are delivered two days after an ordering day (the day after tomorrow). It is also assumed that the ordering cycle shorter than the delivery lead time is considered and the amount of orders is calculated using an ordering amount calculation formula as shown at (b) in Fig.13.
An automatic ordering system according to this embodiment is supplied, in advance, with POS data indicative of actual stock of goods, and the worker for ordering work input to the system (1) information about factors of change of sales volume such as events to be given in the market area and items of goods on bargain sale at own shop, (2) rules for correcting the volume of sales which changes by being affected by the factors of change, and (3) rules for diagnosing selling status and demand status. Following these steps, the system operates to determine the order amount of each item of selling goods and automatically deliver an order slip.
In the second embodiment, the automatic ordering system is constructed as shown, in block form, in Fig.1. Thus, this system comprises a terminal 1, a variable condition setter 2, a sales volume predictor 3, responsive to variable condition data 10, POS data 11 and a correction rule table 15, (these are already fully explained in the first embodiment), an ordering amount calculator 4, responsive to predictive data 12 produced from the predictor 3, for calculating the amount of orders, a rule modifier 6 for modifying the correction rule table 15 and a diagnostic rule table 16 used to diagnose the condition of calculation diagnostic unit 7 for diagnose the condition of calculated d ordering data 14 and stock data 13, a condition diagnostic unit 7 for diagnosing the condition in accordance with the diagnostic rule table 16, and an ordering processor 5, responsive to a diagnostic message 17 produced from the diagnostic rule table 16, and an ordering processor 5, responsive to a diagnostic message 17 produced from the diagnostic unit 7 and ordering data 14, for delivering an order slip 18.
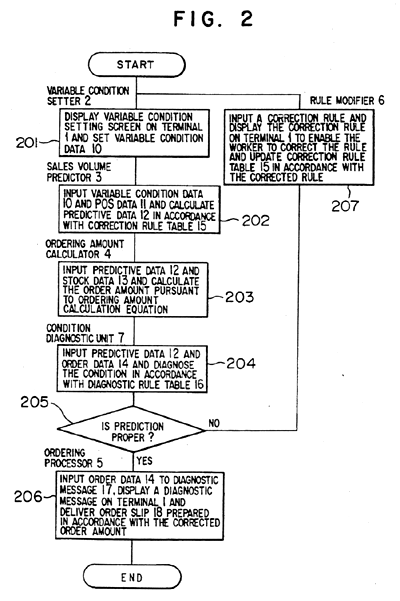
Fig.2 shows a flow chart of the operation of the automatic ordering system.
At first, predictive data 12 is calculated as described in the first embodiment.
An example of the predictive data 12 is shown in Fig.7.
Subsequently, on the basis of the predictive value for the 28th day (stored in the predictive data 12), ordering data 14 ordered on the past days (24th and 25th days) representative of the delivery amount for the 26th and 27th days and stock data 13 which is collected in advance using, for example, bar-cord, the ordering amount calculator 4 executes and ordering amount calculation formula as shown at (b) in Fig.13 to determine the amount of orders which in turn is stored into the ordering data 14 via a signal line 111 (step 203). Fig.8 shows an example of the stock data 13 and Fig.9 an example of the ordering data 14.
As an example, the calculation is carried out using numerical values of the data as follows:
When predictive sales volume for the named day(26th) Vi= 200 (Fig.7), Predicative sales volume for tomorrow (27th) Vi+1 = 220 (Fig.7), Predictive sales volume for the day after tomorrow (28th) Vi+2 = 240 (Fig.7), Run-out of total stock on the precious day (25th) Zi = 300 (Fig.8), Order amount on the named day (26th) h-2 = 220 (Fig.9), Order amount on tomorrow (27th) h-1 = 210 (Fig.9) and Safety stock volume S = 200 are given, the order amount on the day after tomorrow (28th) hi is given by
-
hi ={Vi + Vi+1 + Vi+2}
- { Zi + hi-2 + hi-1}
+ S
={200 + 220 + 240}
- {300 + 220 +210}
+ 200
=130
The daily ordering work is carried out through the above operation (prediction and calculation of the order amount). Unless abnormal phenomena take place, the above procedure is sufficient. In a lot of goods, however, various types of abnormal phenomena occur and the present invention is directed to the provision of the condition diagnostic unit 7 adapted to take care of the abnormal phenomena.
The condition diagnostic unit 7 is operable to perform the following procedure. Firstly, the condition diagnostic unit 7 is supplied with POS data 11, stock data 13 and diagnostic rule table 16 via signal lines 115, 117 and 126, respectively, and it analyzes tendency to sell to know whether the volume of sales of individual goods groups and individual goods increases or decreases, by applying the method of least squares to the sales volume in POS data in respect of individual goods groups and individual goods. The condition diagnostic rules so that a condition diagnostic screen may be sent via a signal line 127 to the terminal 1 and displayed thereon in respect of individual goods group and individual good which match the diagnostic rules. Fig.10 shows an example of the diagnostic rule table and Fig.11 and example of the condition diagnostic screen.
Tendency to sell 1101 on the condition diagnostic screen of Fig.11 indicates that in the POS data, the total sales volume of the goods group "chocolate" is increasing and the sales volume of the goods "B chocolate" is decreasing, and therefore a diagnostic rule 1001 shown in Fig.10 is activated to display a diagnostic message 1102 on the condition diagnostic screen. Reversely, in case the total sales volume of "chocolate" is decreasing and the sales volume of "B chocolate" is increasing, a reverse diagnostic message in respect to 1102 is shown.
Furthermore, if the volume of sales of a goods item "X" changes to "increase" as indicated in a diagnostic rule 1002 shown in Fig.10, the safety stock volume of the goods must be "increased" and a diagnostic message to this effect is stored in the diagnostic message 17. This is because the safety stock volume in the calculation formula shown at (b) in Fig.13 is the term for aborbing the change (error) which is unforeseen. For example, if the safe stock volume is 200 as in the case of item 802 of "B chocolate" shown in Fig.8, ordering is repeated such that 200 pieces of B chocolate are always in stock.
Accordingly, for the difference between demand and prediction being about 200, no problem occurs but when the difference exceeds 200, trouble occurs. In order to increase the safe stock volume, however, various conditions including stock space and budget must be checked and in the design of this embodiment, only a message "increases the safe stock volume" is delivered.
Further, when a comparison of POS data 11 with the contents of predictive data 12 for the previous day shows an offset between these data which exceed a predetermined value in respect of a goods item as indicated in a diagnostic rule 1003 in Fig.10, especially when the prediction misses greatly for some factors, not preset, in respect oof the goods item, the order amount of the goods item must be changed by the worker.
Even in the presence of the offset, the difference, if not so large, may suitably be absorbed or cancelled out within two to three days by the safe stock, raising no problem but, if large, must be corrected. This is because, if the offset happens successively, the wrong predictive value obtained on the previous day (in the above-described example, the 25th day) is used to erroneously calculate amounts of supply goods for the named day (26th) and tomorrow (27th) and there result erroneous order amounts for the named day (26th) and tomorrow (27th). It may of course be conceivable to command correction of errors in the order amounts but the order once given to a supplier is difficult correct. Accordingly, a better way to cope with the possible erroneous order amounts is to correct the amount of orders on the named day (the amount of delivered or supplied goods for row 28th day) on the basis of the worker's judge whether this offset will happen successively or not. To this end, in accordance with the invention, prediction and actual results of sales obtained on the previous day are constantly compared with each other so that an item of goods for which the difference exceeds a predetermined value may be picked up and a message indicative of the name of the goods item and the amount of difference may be stored in the diagnostic message 17.
In this manner, the condition diagnostic unit diagnoses to provide various diagnostic messages which are stored in the diagnostic message 17.
Subsequently, the ordering processor 5 fetches ordering data 14 and diagnostic message 17 via signal lines 112 and 132, respectively, and delivers an order amount and the diagnostic message to the terminal 1. The worker corrects the displayed order amount by locking up the diagnostic message. The ordering processor 5 fetches the corrected order amount via a signal line 130 to update the ordering data 14 and delivers and order slip18. Fig.12 shows an example of the order slip. The worker consults the diagnostic message 1102 to correct the order amount, generally indicated by reference numeral 903 and calculated to be "130" by the ordering amount calculator, to "50" for "B chocolate" in item 1201 of the order slip of Fig.12.
The condition diagnostic unit 7 also functions to correct the correction rule table 15 if there is a large difference between predictive data and results. For example, in if spite of the fact that the correction rule prescribes a "20%" increases in sales volume of item "chocolate" under the condition of "T elementary school" and "excursion", the "20%" increase rule does not effect the actual condition and must be corrected.
There are two main ways of doing correction, one being to obtain values through a presumption method by which the square sum of differences between actual establish a new rule by using the thus obtained values and the otherbeing to obtain values through weighted average of values estimated by the method of least sequently, the rule modifier 6 sends a modified correction rule to the terminal 1 via a signal line 119 so that the modified correction rule containing the corrected values are displayed emphatically in a different color. The worker can modify the correction rule thus displayed on the terminal 1, as necessary. The rule modifier 6 updates the correction rule table 15 via a signal line 121 (step 207).The operations in steps 201 to 204 are repeated until correct prediction can be obtained.
As described above, since in the automatic ordering system of this embodiment the variable condition setter 2 is operative to store the inputted variable condition into the variable condition data 10, the worker can grasp factors of change, the worker can easily modifies (correction and addition ) the correction rules so that the amount of change of sales column may be incorporated in the correction rule table 15. When the worker simply inputs the variable condition representative of events about to be given, the sales volume of individual foods groups and individual goods, which complies with carious events, can automatically be predicted and the order amount complying with the variable condition can be calculated on the basis of prediction results in respect of individual goods. Further, diagnostic rules used to provide a diagnostic message indicative of discrepancy between selling status and stock status are stored in the diagnostic rule table 16 and the worker can easily modify (correction and addition) the diagnostic rules.
Among a lot of goods, only goods having discrepancy between selling status and stock status can be selected in accordance with the diagnostic rule to provide a proper diagnostic message which enables the worker to emphatically grasp the stock status and selling status of only the questionable goods and to determine proper order amounts.
The foregoing embodiment has been described as being directed to ordering work but by connecting the automatic ordering system 1401 to a POS system 1402 for controlling the sales volume via the POS data 11 and a stock control system 1403 for controlling the stock volume by using bar-codes and the like via the stock data 13, a retail shop system for controlling the whole route covering sales and arrival/delivery of goods may be constructed as shown in Fig.14. In alternatives, the variable condition setter 2 may precedently be inputted with a variable condition valid for a period of time to permit the sales volume predictor 3 to predict the volume of sales for sales for that period of time, thereby delivering a sales plan; and the condition diagnostic unit 7 may calculate the amount of change of selling on the basis of the past contents of the POS data 11 to automatically correct safely stock volume predictor 3 operative to average sales volumes over a few days of the same day of the week in this embodiment may be so modified as to perform prediction by averaging sales volumes over a month or a week. In addition, in the diagnostic rule table 16, some rules may be activated preferentially, some rules interfering with each other may be prevented from activation or some rules to which priority is given by the work may be activated preferentially, with a view of improving efficiency of diagnostic process.
In addition to the ordering work mode described in the foregoing embodiment where ordering is done every day and delivery is received two days after an order date, a fixed period ordering mode may be adopted wherein ordering is done not every day but at an interval of a few days, a fixed quantity ordering mode may be adopted wherein the order amount is fixed, or a mode wherein the lead time is different for individual items of goods or individual seasons. The present invention may similarly be applied to these ordering modes by simply changing the ordering amount calculation formula and the contents of the diagnostic rule table.
Further, in addition to controlling of goods suitable for stock (chocolate) exemplified in the foregoing embodiment, goods almost unsuited for stock such as perishable goods may be controlled similarly in accordance with the present invention by using a modified ordering amount calculation formula which is:
-
order amount hi =sales volume for tomorrow
Ui+1 (predictive volume)
According to the invention, by inputting the variable condition representative of events and the like to be given in the market area by making the most of worker's, particularly, shop manager's knowledge, the amount of change of selling of individual goods can automatically be reflected on the order amount and accordingly the amount of orders of goods expected to be sold at own shop can be increased to enable own shop to increases the amount of sales in accordance with the market condition. Also, selling status and stock status can automatically be diagnosed in respect of individual goods groups and individual goods by making the most of worker's, such as shop manager's, knowledge and therefore surplus order of goods not expected to be sold can be prevented, thereby promoting economy. Further, a diagnostic message is provided in respect of only goods to be subjected to ordering, thereby promoting efficiency of ordering work. Moreover, the sales volume can be predicted accurately on the bases of the variable condition representative of schedules of events and the like over a month or a year to prepare preparation of a business plan at a shop and efficient prosecution for business at the shop.
claims:
1. An automatic predictor system, adapted to predict future data from past time series data, said system comprising:
variable condition data storage means for storing condition data ;
past time series data storage means for storing past time series data comprising actual results of historical data ;
correction rule table storage means for correction rules for correcting initial predictied data based on average past time series data; and,
predictor means operatively associated with said variable condition data storage means , the time series data storage means, and correction rule table storage means and storing the predicted future data as predictive data in a predictive data storage means.
1.(modified)* An automatic predictor system, adapted to predict future data from past time series data, said system comprising:
variable condition data storage means for storing condition data ;
past time series data storage means for storing past time series data comprising actual results of historical data ;
correction rule table storage means for correction rules for correcting initial predicted data, the initial prediction being based on average past time series data, the correction rules taking into consideration said variable condition data; and,
predictor means operatively associated with said variable condition data storage means, the past time series data storage means, and correction rule table storage means, for performing said initial prediction and correction ,and storing the predicted future data as predictive data in a predictive data storage means.
2. An automatic predictor system according to claim 1 wherein said past time series data is comprised from electric power supply demand.
3. A method of predicting sales volume of various resources sold in mass at a supermarket or the like comprising the steps of
the first step of gathering variable condition data inculding weather, entertainment, events at competitive shops or bargain sales;
the second step of gathering point of sale data; and,
the final step of predicting sales volume fromsaid variable condition data , point of sale data and correction rule.
4. An automatic predictor system, adapted to predict sales volume at a supermarket or the like, said system comprising:
variable condition data storage means for storing condition data reflecting variable sales conditions including weather, entertainment, events at competitive shops or bargain sales;
point of sale data storage means for storing point of sale data comprising actual results of historical selling of the various resources;
correction rule table storage means for correction rules for correcting initial predicted sales volumes based on average sales conditions;and,
sales volume predictor means operatively associated with said variable condition data storage means for predicting a future demand for the various resources on the basis of the condition data, the point of sale data, and the correction rules and storing the predicted future demand as predictive data in a predictive data storage means.
4.(modified)* An automatic predictor system, adapted to predict sales volume at a supermarket or the like, said system comprising:
variable condition data storage means for storing condition data reflecting variable sales conditions including weather, entertainment, events at competitive shops or bargain sales;
point of sale data storage means for storing point of sale data comprising actual results of historical selling of the various resources;
correction rule table storage means for correction rules for correcting initial predicted sales volumes, the initial prediction of sales volumes being based on average sales conditions, the correction rules taking into consideration said variable condition data; and,
sales volume predictor means operatively associated with said variable condition data storage means for predicting a future demand for the various resources on the basis of the condition data, the point of sale data, and the correction rules , for performing said initial prediction of sales volumes and correction,and storing the predicted future demand as predictive data in a predictive data storage means.
5. An automatic predictor system, adapted to predict sales volume at a supermarket or the like, said system comprising:
variable condition data storage means for storing condition data reflecting variable sales conditions including weather, entertainment, events at competitive shops or bargain sales;
point of sale data storage means for storing point of sale data comprising actual results of historical selling of the various resources;
correction rule table storage means for correction rules for correcting initial predicted sales volumes ;and,
sales volume predictor means operatively associated with said variable condition data storage means for predicting a future demand for the various resources on the basis of the condition data, the point of sale data, and the correction rules and storing the predicted future demand as predictive data in a predictive data storage means.
5.(modified)* An automatic predictor system, adapted to predict sales volume at a supermarket or the like, said system comprising:
variable condition data storage means for storing condition data reflecting variable sales conditions including weather, entertainment, events at competitive shops or bargain sales;
point of sale data storage means for storing point of sale data comprising actual results of historical selling of the various resources;
correction rule table storage means for correction rules for correcting initial predicted sales volumes, the correction rules taking into consideration said variable condition data ;and,
sales volume predictor means operatively associated with said variable condition data storage means for predicting a future demand for the various resources on the basis of the condition data, the point of sale data, and the correction rules , for performing said initial prediction of sales volumes and correction,and storing the predicted future demand as predictive data in a predictive data storage means.
* Taking into consideration the comments from the USPTO, claims 1,4 and 5 of the hypothetical application 2 are modified.
HYPOTHETICAL PRIOR ART FOR CASE 2
The automatic predictor system is constructed as shown, in block from, in Fig.1. Thus,this system comprises a terminal 1 through which input/output of information is effected by the worker, a variable condition setter 2 for setting variable condition data 10 indicative of factors of change, a predictor 3, responsive to variable condition data 10, past time series data 11 and a correction rule table 15 for storing correction rules used to correct the initial predictive data, for predicting predictive data.
Firstly, the variable condition setter 2 provides a condition setting screen which is sent via sent via a signal line 101 and displayed on the terminal 1, and the worker input information indicative of variable condition data so that the information is applied via a signal line 104 to the variable condition data 10.
Precededently, information has been stored in the variable condition data 10. In order to newly input or change the variable condition necessary to predict the future data, the worker first input a data of seetting the variable condition setter.
The inputted information is then supplind via a signal line 102 to the varable condition setter 2 which in turn updates the contents of the variable contents of the variable condition data 10 or input new data thereto via the signal 104.
The predictor 3 is then supplied with the newly inputted contents of variable condition data 10 via a signal line 105, time series data 11 collected in the past via asingnal line 106 and correction rule table 15 via a performs calculation to predict the future data.
Firstly, predictive data is calculated from a series of past data by extrapolation. In Fig.2, for exmaple, the thus calculatde predictive data assumed to be "200".
Subsequently, the correction rules are activated by information from the variable condition data shows a factor of change "A" and a correctoion rule shows a "20% increase" of the data under the above condition "A", the predictive data "200" is corrected so as to be 20% increased "240".
FIG1
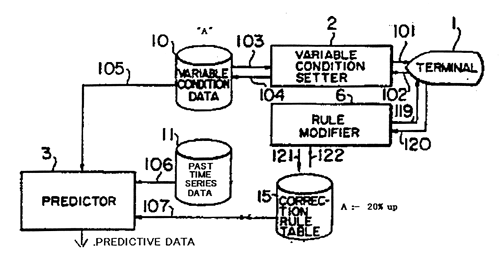
FIG2
